..using alpha-CAT TLC method and GC-FID
By Sébastien Béguerie & Ignacio García
7th International Conference on Cannabinoids in Medicine
IACM, Cologne, Germany, September 27-28, 2013
Introduction
- Medicinal Cannabis consumption all over the world is increasing which stress the need for risk prevention to understand cannabinoids therapeutical values and potential side effects. Thus it becomes important to test every cannabinoid matrix for its dosage (Grant and al., 2012).
- A wide variety of methodologies has been recommended for the determination of marijuana samples or Cannabis plants: Thin layer Chromatography (TLC), Optimum Performance Laminar Chromatography (OPLC), High Pressure Liquid Chromatography (HPLC), Gas Chromatography (GC) with Mass Spectometry (MS), capillary electro-chromatography, time-resolved fluoro-immunological method, immunoassay, etc... Most of these techniques require heavy and costly instruments and a lot of time (Galand et al, 2004).
- It is mandatory to ensure traceability in production. The Food and Drug Administration (FDA) requires that all pharmaceutical, nutraceutical and food companies that adhere do not test medical Cannabis raw materials or provide cannabinoids dosage information of derived products, leaving patients in the dark about what they're inhaling or ingesting. (Steve Kilts, 2012).
- Semi-quantification by densitometry with TLC analysis methods have been performed (Fischedick et al, 2009).
- TLC can be the method of choice if the target is to carry on a big number of samples in a rapid, visual and simultaneous. Unlike the comparison of two samples in order to assess whether they are the same (or different), when quantitative analysis is essential, assessment of origin is qualitative, since the sample under study and the reference samples are, in fact, different. There is thus little point in using more powerful techniques such as
HPLC as the quantitative information provided is likely to confuse the picture (Baker et al, 1980). - TLC is a low-cost method for cannabinoid analysis and approved by the United Nation Office on Drugs and Crimes (UNODC) for Cannabis routine
control of cannabinoid content and of Cannabis origin (Laboratory and Scientific Section UNODC, 2009).
Alpha-CAT (Cannabinoid Analysis Test) enable Cannabinoid spot to be calibrated by, taking ratio of pixel counting/surface area within each cannabinoid % range by using Photoshop and Excel computer programs. It is obtained a regression curve which showed a linear correlation. From the regression line of CBD, CBN, THC, THCV, CBG and CBC; spot area calibration charts were designed as rulers to have an handy and visual way to measure % according to spot size revealed on TLC plate.
In order to verify how accurate cannabinoids % can be read with the alpha-CAT's rulers, it was performed a blind comparative study by using the GC-FID apparatus, property of Fundación CANNA, and alpha-CAT TLC kit for the quantification of THC, CBD and CBN.
Materials and Methods
GC-FID conditions: 50 mg of dried and homogenized inflorescences were extracted with 2000 μl of a 9:1 methanol:chloroform mixture and 0.2 g/l of Phenanthrene and samples were sonicated for 15 minutes in an ultrasonic bath. An aliquot of 200 μl of the extraction was transferred to a chromatography vial with 1000 μl of methanol. The cannabinoids content was analyzed in a GC with FID detector. The quantification was performed using a calibration curve which was constructed using the ratio of the areas between the internal standard and various concentrations of cannabinoids reference standards. CBN was used for the calibration instead of THC (Poortman van Der Meer et al, 1999). The method allows a good separation of the cannabinoids CBD, CBC, THC, CBG and CBN.
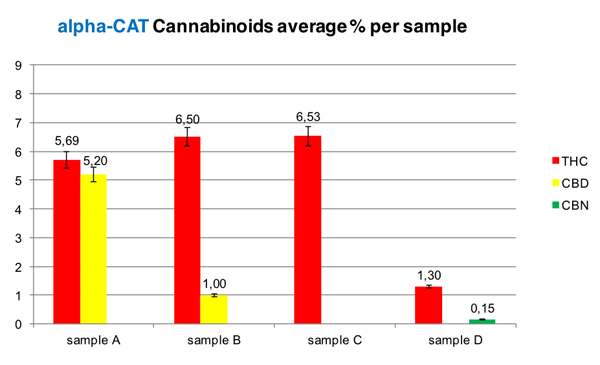
Graph 1: alpha-CAT results
Alpha-CAT conditions: 100mg of dried and homogenized inflorescences were extracted with a solvent mixture that will be called “Test fluid” for 2 minutes and was transferred with a 2 μl capillary tube on a 5x10 cm plate pre-coated silica gel (TLC F254). Decarboxylation was achieved at 150°C for 40 seconds using alpha-CAT ‘s heating device and alignment tool. Plates were developed and colored by using Fast Blue B salt dye. Quantification was performed by reading the correspondent cannabinoid percentages using alpha-CAT cannabinoids rulers. (picture1).
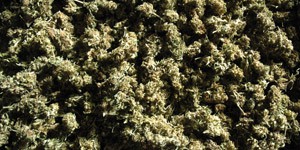
4 homogenized batches of different Cannabis varieties were used for this comparative study. 3 samples of each batch were analyzed by TLC and 3 by GC/FID. The laboratory procedures were done at CF location and the TLC results were blind tested, carried on by plate image scans to alpha-CAT laboratory head quarter’s email for cannabinoid quantification reading alpha-CAT with its correspondent cannabinoids rulers.
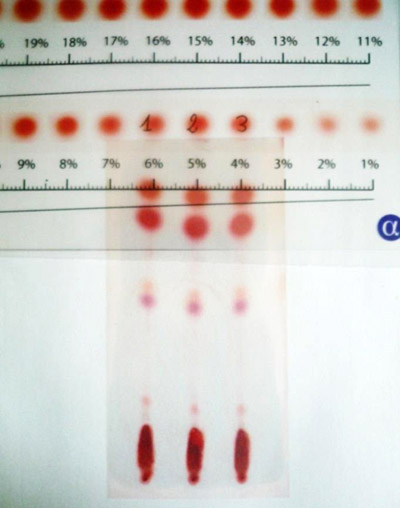
Picture 1: alpha-CAT densitometry method, using alpha-CAT cannabinoid calibration %
Discussion
The average percentages of each sample were compared. Differences between 15,40% and 48,82% were detected in quantifying THC and a 34,25% in quantifying CBD when comparing the two methods. The ratio of THC:CBD was proportionally comparable (Graph 2). When CBD and CBN were below 1%, there was an incoherence in terms of quantification, even though they were detected properly. This was the first straight forward comparative study between GC-FID and the TLC alpha-CAT's protocol.
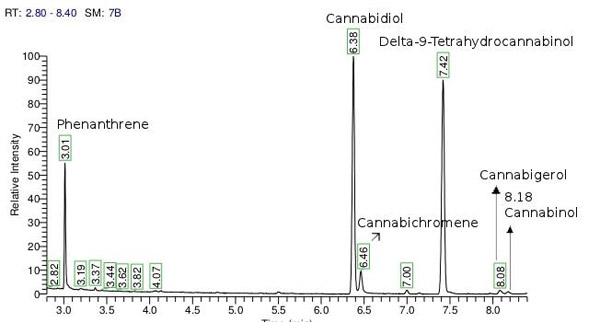
Picture 2: GC-FID cannabinoids peaks of identification and quantification
Alpha-CAT's testing method has shown to be a valid qualitative tool for cannabinoid detection and gives reproducible results. However, only technicians well trained with alpha-CAT's kit method can obtain semi quantitative results by using the alpha-CAT’s cannabinoids rulers. Gas or Liquid chromatographic analysis need to be used to quantify precisely cannabinoids, and other important secondary active compounds present in Cannabis.
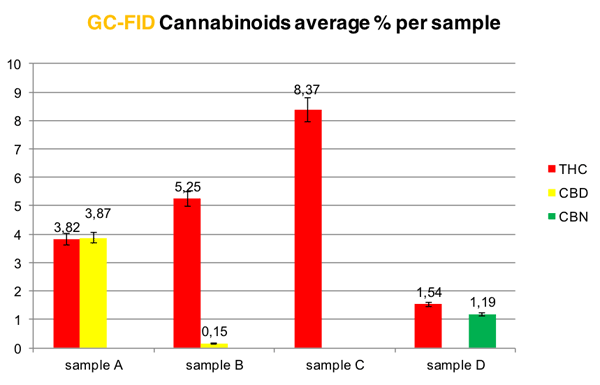
Graph 2: GC-FIC results
References
- Igor Grant, Hampton Atkinson, Ben Gouaux, and Barth Wilsey. Medical Marijuana: Clearing Away the Smoke. Open Neurol J. 2012; 6: p. 18–25.
- Galand N, Ernouf D, Montigny F. Separation and identification of Cannabis components by different planar chromatography techniques (TLC, AMD, OPLC). J Chromatogr Sci. 2004 Mar; 42(3) : p.130-134.
- Steve Kilts, vice president of CannLab, Denver, CO, USA. Industry Needs to Start Taking Medical Cannabis Testing, Labeling Seriously. Medical Marijuana Business Daily, www.mmjbusinessdaily.com, 2nd of October 2012.
- Justin T Fischedick, Ronald Glas, Arno Hazekamp, Rob Verpoorte. A qualitative and quantitative HPTLC densitometry method for the analysis of cannabinoids in Cannabis sativa L. Phytochem Anal. 2009; 20(5): p.421-426.
- P. B. Baker, T. A. Gough, B. J. Taylor. Illicitly imported Cannabis products: some physical and chemical features indicative of their origin. Bulletin UNODC. 1980, p.31-40.
- Laboratory and Scientific Section UNODC, Recommended Methods for the Identification and Analysis of Cannabis and Cannabis Products, United Nations, publications 2009, p.36-39.
- Poortman-van der Meer, A.J. and Huizer, H. A contribution to the improvement of accuracy in the quantitation of THC. Forensic Sci int 1999. 101, 1-8